Charts (1) is accessed by clicking this icon ![]()
The page you see will look something like this:
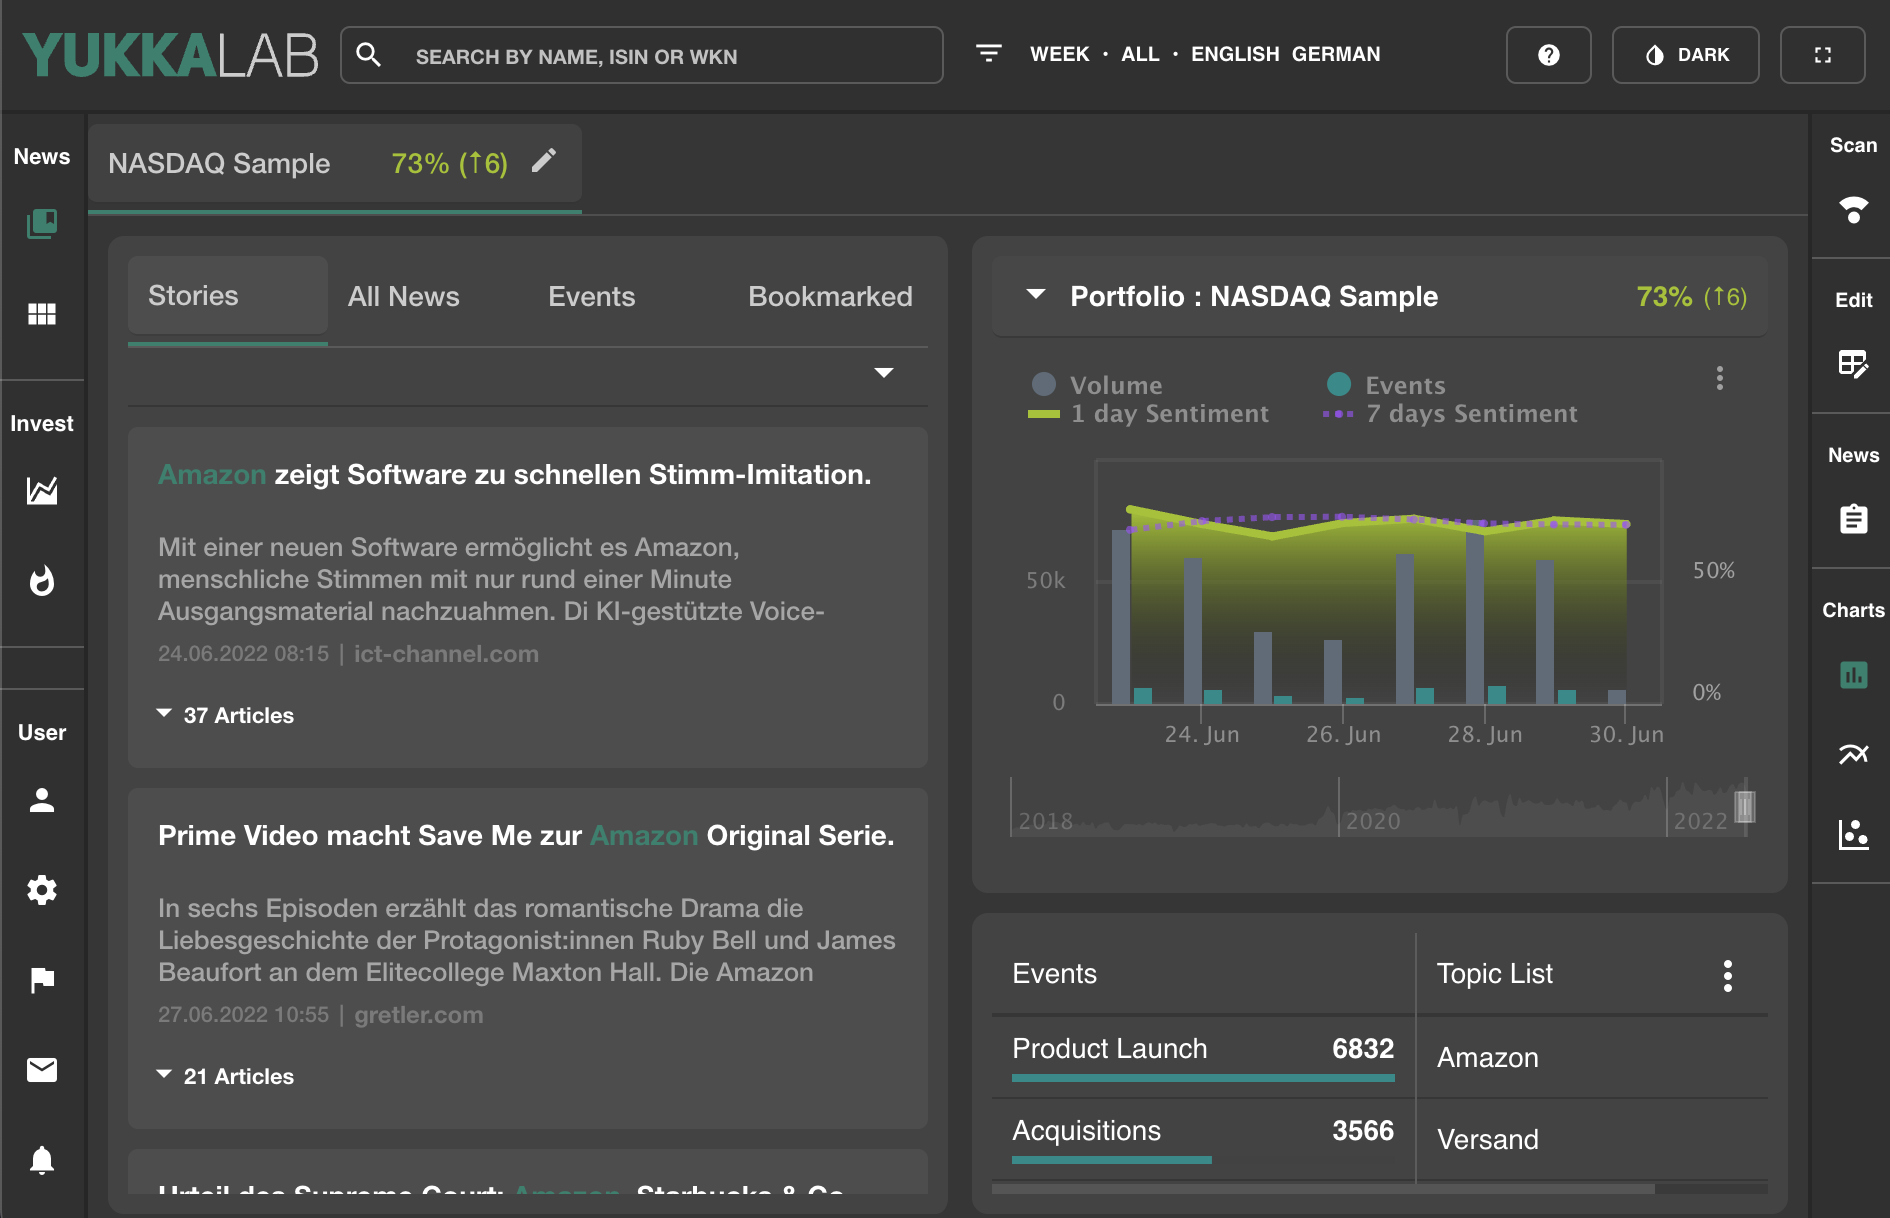
The left side is reserved for a news overview. Default setting is stories, but you can also access "All News" , an "Event" overview and your "Bookmarked" news.
If you click on the ![]() in the upper right, a context menu will be opened
in the upper right, a context menu will be opened

A "Legend" with details on the chart.
"Average 1 & 2" also provide additional information on the chart.
"Annotation" will show up all Annotations that have been created for the chart.
"Fixscale" will reload and normalise the settings for the chart.
"Screenshot" will provide a screenshot in png format.
(This will not only be the chart, but the entire cockpit view that you currently see. )
"Export" will allow you to do just that for the information available here:

Each of the options can be downloaded in several formats.
Below that you find your mosaic, with a top list of events and topics.
Clicking on either of them, will allow you to focus on the news specific to that event or the topic.
Using ![]() will open a context menu that will allow you to disable either of them.
will open a context menu that will allow you to disable either of them.