(A full list of events is available in the glossary of the Help Centre and in the events listing in the filter settings in the cockpit.)
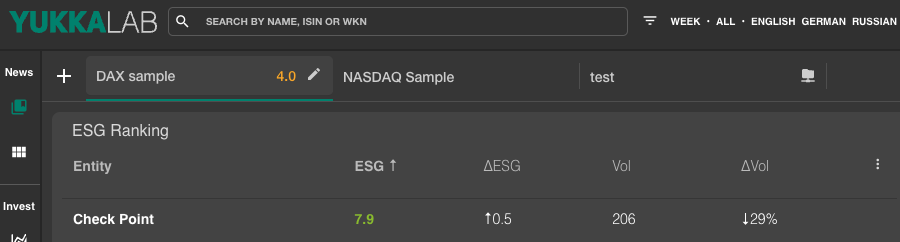
When you log into your YukkaLab account, you will start on your portfolio page, with a view something like this:
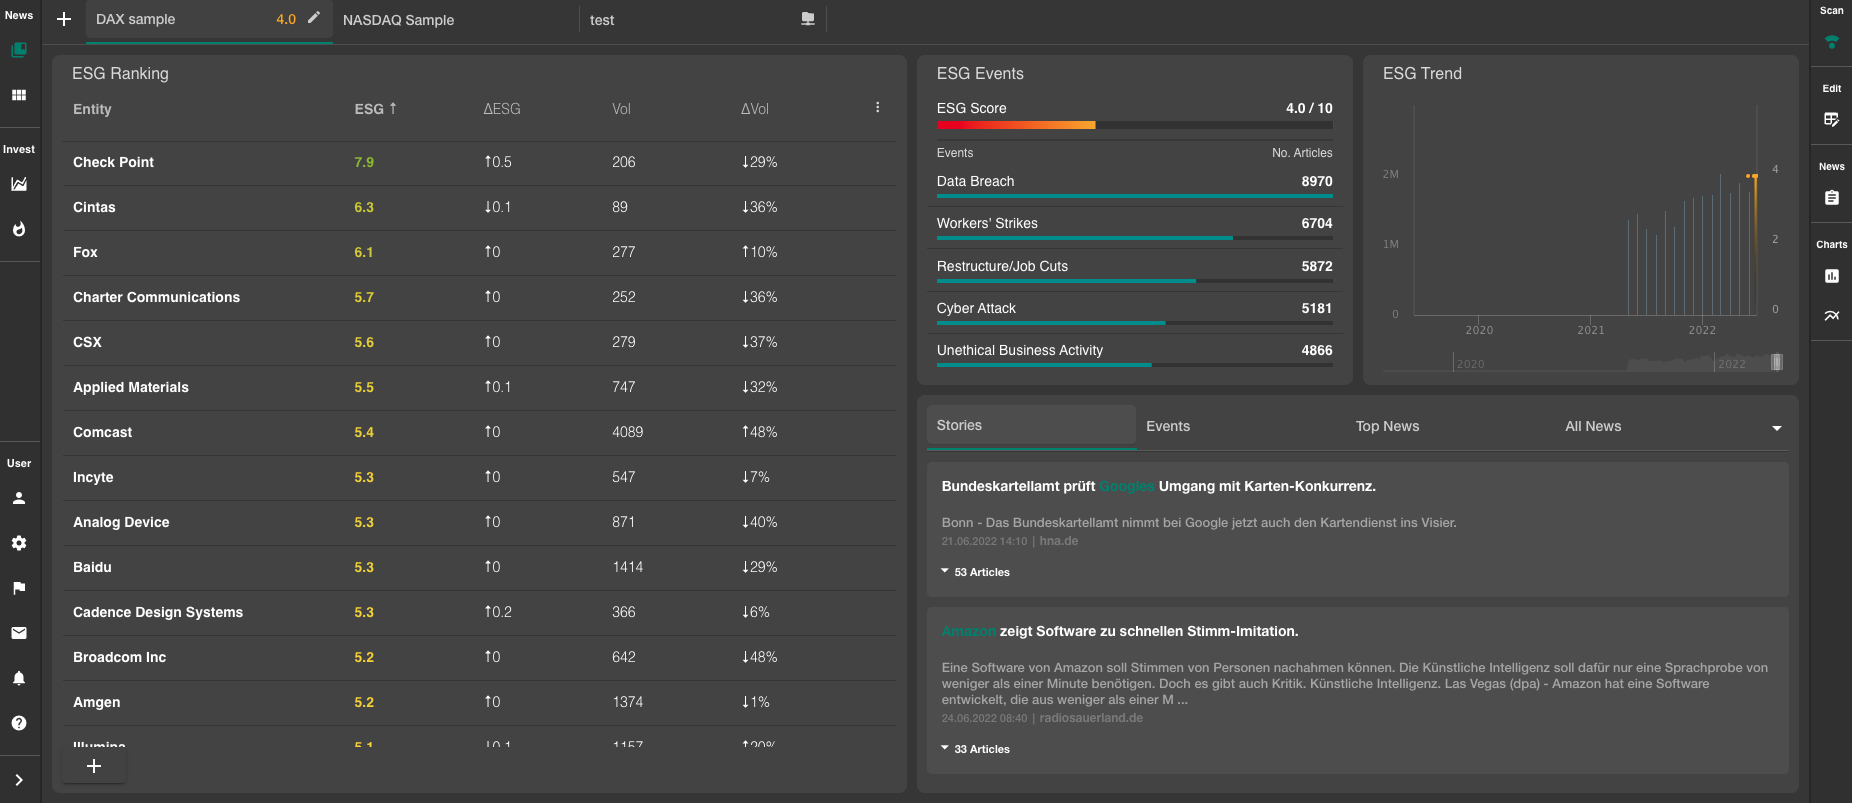
On the left you will see the entities that are listed in your portfolio.
From left to right the following information is depicted:
Entity - shows the entity that has been listed in the portfolio
ESG ↑- shows the ESG rating, based on the news in the timeframe that has been set in the filters. (The upwards pointing arrow shows the order in which the data is sorted, here highest ESG Ranking first.)
Important: Ratings are nice, but meaningless without a bit more information.
Please check the Glossary articles for the scores, for more details on how they are calibrated.
ΔESG - indicates the tendency in which the score is developing. (In the above example the rating increased by 0.5.)
Vol - is the absolute volume of articles that have been found for the entity in the timeframe in question.
ΔVol - is the difference in % for the amount of articles available for the entity in the timeframe in question. (In this case a decrease of 29% in the timeframe.)
On the upper half of the right side screen, you will see something that resembles this:
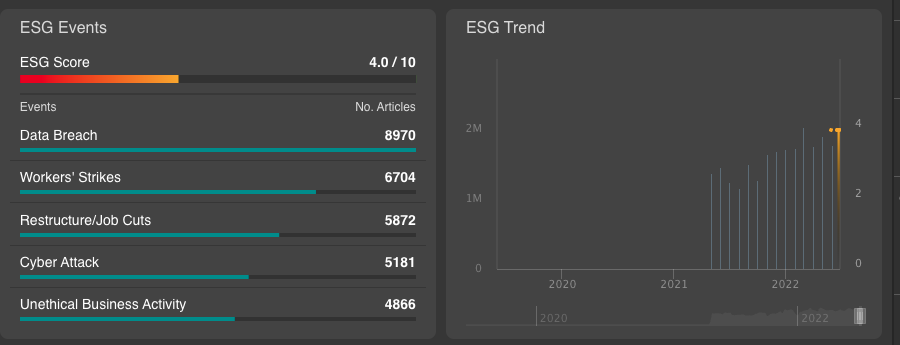
This is a general overview of all the entities in your portfolio.
Selecting the same example entity as above, the view will change to this:
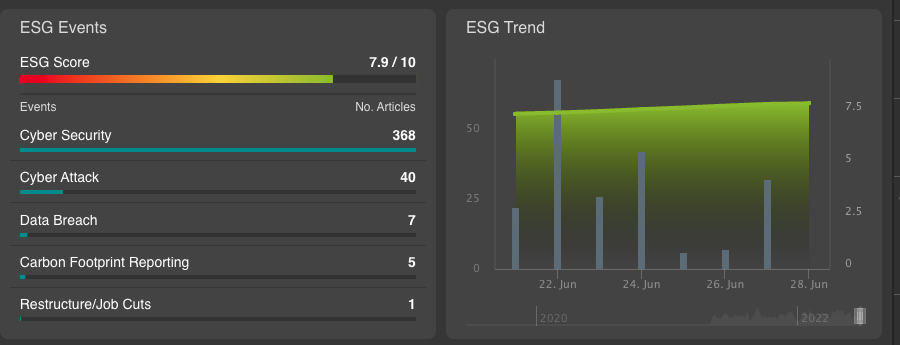
Now the data is only shown for the entity in question.
As in the screenshot above, the left side shows the ESG Events that are responsible for the calculation of the score.
Note: A full list of events is available in the glossary of the Knowledge Base and in the events listing in the filter settings in the cockpit.
The left side always shows the Event in question, while the right shows the amount of instances in which this event has been detected by the AI.
As you can see, cybersecurity and cyber attacks are the dominant topics in the example.
For more information click on the event in question. The view in the lower part will change and give you a detailed overview of the specific news that triggered the event.
Clicking the event will automatically sort the news by event.
On the right you see the ESG Trend, a graph based on the events, showing the development of the ESG Score for the entity (or the portfolio if no entity is selected) over time.
In the current view, two different datasets are depicted.
The columns indicate the volume of events on any given date.
The line above depicts the overall ESG Rating of the entity (or the portfolio).
As it is always a bit "tedious" to get very detailed information out of such a graph, we included a help, that will make it a lot easier to be read.
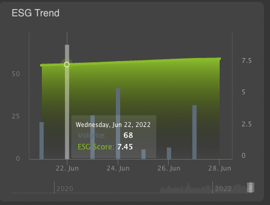
Hovering the Cursor over the bar or the line will show a "detail" view, that states the absolute volume and the ESG Score for this point in time.
The lower part of the screen is populated by the actual news.
Unless a event has been selected above, the default setting for the news view is "Stories".
For more information on the different news views, please have a look at the glossary entries linked here.
Hovering over an article will show a small preview of the news text.
Clicking on a news headline will open a preview of the article or the full text, if possible.